Analytical reports
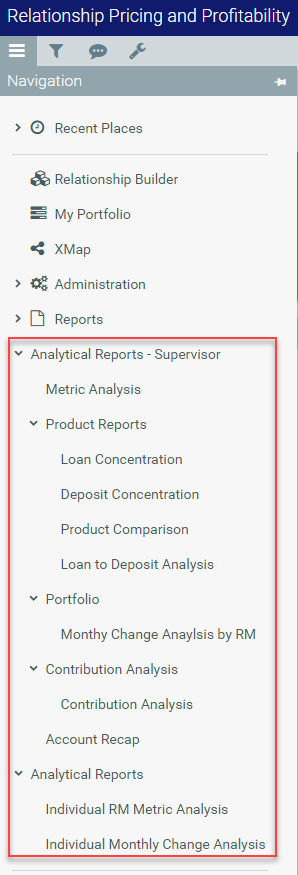
Axiom RPPS includes several analytical reports accessible from the Navigation menu. These reports are access restricted based on your user role.
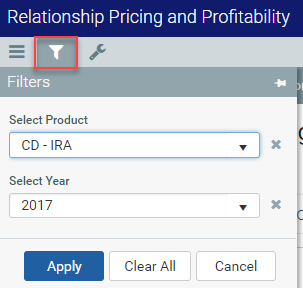
Click the filter icon and select options to adjust data displayed on report dashboards. This is where you select specific time periods and products displayed in many of the reports.
The section below briefly describes each new analytical report set and the dashboards available within each.
Metric Analysis (Supervisor access)
This report includes the following dashboards:
- Metric Analysis - Includes KPI metrics for the relationships with the highest monthly contribution, 12-month contribution, and 12-month Risk Adjusted Return on Capital (RAROC) as well as the lowest monthly contribution, 12-month contribution, and 12-month Risk Adjusted Return on Capital (RAROC).
- RM Ranking - Includes a ranking of the top and bottom 10 relationship managers by 12-month contribution and 12-month RAROC.
- Decile Analysis - Includes a decile analysis for 12-month contribution and 12-month RAROC metrics. There are 10 deciles for both metrics. Each decile contains 10% of institution wide relationships. Decile 1 is the highest performing decile with Decile 10 being the lowest performing.
-
Decile by RM - Includes a decile analysis for 12-month contribution and 12-month RAROC metrics by Relationship Manager. All charts reflect analysis for 12-month contribution. There are 10 deciles for both metrics. Each decile contains 10% of institution wide relationships. Decile 1 is the highest performing decile with Decile 10 being the lowest performing. Click each decile name in the Decile column to drill-down for more detail.
Click the drop-down in the RM % of Decile - Count graph to select a new Relationship Manager. Axiom Financial Institutions Suite will recalculate the dashboard data relevant to the new selection.
Product reports (Supervisor access)
These reports include the following:
- Loan Concentration - Includes dashboards with analysis of loan concentration for all product types, loan concentration for all products across and within states. Metrics include current balance, net contribution, RAROC, allocated capital for product types, and allocated capital for states.
- Deposit Concentration - Includes dashboards with analysis of deposit concentration for all product types, deposit concentration for all products across and within states. Metrics include current balance, net contribution, RAROC, allocated capital for product types, and allocated capital for states.
- Product Comparison - Includes KPIs, graphs, and a ranking to allow you to compare products for a selected month.
- Loan to Deposit Analysis - Includes Loan to Deposit Vintage and Prospective (Maturity) analyses allowing you to view historical trends for loans and deposits for a selected year as well as determine the effect of maturing dollars (or culmulative maturing dollars) on overall portfolio performance.
Portfolio (Supervisor access)
The Monthly Change Analysis by RM report provides a ranking and analysis of contribution of each Relationship Manager. The Supervisor role can select individual Relationship Managers to view detailed data specific to that individual.
Contribution Analysis (Supervisor access)
The Contribution Analysis report is located in its own category. This report provides two dashboards:
- Product Contribution Vintage Analysis - Allows you to analyze historical contribution trends by product for a selected year and to see how much of the current contribution for a selected product has been originated through time.
- Portfolio Contribution Maturity Analysis - Allows you to analyze how a selected product's current profitability will be running off over the next 12 months.
Account Recap (Supervisor access)
The Account Recap allows you to look up a specific account and view attribute and profitability metric data for that account.
Non-supervisor restricted reports
The following reports are available to all users with the Relationship Manager role:
- Individual RM Metric Analysis - Includes the metric analysis for the individual Relationship Manager logged into Axiom RPPS. Provides KPIs based on their specific portfolios and a list of highest and lowest contributing relationships by monthly contribution, 12-month contribution, and RAROC.
- Individual Monthly Change Analysis - Includes the monthly change analysis for the individual Relationship Manager logged into Axiom RPPS. Provides monthly KPIs for the current publish date and the preceding month.
